Exploiting Visual Studio via dump files - CVE-2024-30052
This blog post will talk about CVE-2024-30052, which allows arbitrary code execution when debugging dump files in Visual Studio. I reported this issue to Microsoft in August 2023 and they provided an update that addresses this issue in June 2024. Below I share some details about the vulnerability, as well as poc / exploit-ready code on my github.
contents
- 0.0 introduction
- 1.0 embedded PDBs, embedded sources
- 2.0 non-printable files
- 3.0 crafting a poc
- 4.0 hunting an ace
- 5.0 the exploit
- 6.0 the fix
- 7.0 timeline
0.0 introduction
At my day job, I find myself debugging dump files in Visual Studio quite often. These are invaluable for investigating low-repro crashes or program states that we want to prevent from happening. Quite often, the dump files will come from untrusted places - most large companies that deploy native applications on e.g. Windows will have an automated system for detecting crashes, in which case a dump file is gathered as part of telemetry and uploaded to a portal that developers can access in order to triage crashes. For example, Google uses a custom version of crashpad to capture and report crashes in Google Chrome.
This potentially exposes developers to attacks via dump files. If there’s a vulnerability in Visual Studio that can be triggered by opening a specifically crafted dump file, a malicious user could insert this dump file into the crash reporting system and simply wait until a developer opens it. It also wouldn’t be out of the ordinary for an end user to manually send a dump file in e.g. a support ticket, which would probably increase the chances of the developer opening the file. The main opportunity for an attack is via PDB files, that can be provided along with a dump file (under arbitrary extensions if needed), that VS will happily open during the debug session. In general, PDBs are rather unsafe:
- They can contain visualizers that could execute arbitrary code when trying to visualize some data in VS.
- They can contain source server configuration that executes an arbitrary command when attempting to fetch a source file.
However, visualizers specified through PDB files are disabled during dump debugging, and source server commands are disabled by default and require the user to manually enable them. Instead, in my previous research I focused on finding vulnerabilities that don’t require either of these components, and have found many that MS has fixed in the meanwhile. Most of these were located in msdia140.dll, the library used for parsing and querying PDB files. All of the issues were memory corruption bugs. Even though some of these corruptions were pretty exploitable, I didn’t feel like they would be realistically used in real world attacks.
Last year, I decided to investigate other libraries that Visual Studio uses during its debug sessions, in hopes that a logic bug may be hiding somewhere, allowing code execution without relying on memory corruption. I ended up finding a way to run arbitrary code when debugging a managed dump file.
TL;DR
Spoilers here (click to expand)
- When debugging a dump file with full heap memory containing an executable with an embedded PDB, with the PDB having an embedded source file, Visual Studio will automatically open the embedded source file if it corresponds to a source code line present on the call stack of the primary (crashing) thread in the dump file.
- When attempting to open a file that contains binary (i.e. non-printable) characters, Visual Studio will default to opening the file with the default editor associated with the extension on the OS.
- Exploiting these two behaviours, an attacker can craft a special dump file that internally contains a “source file” that Visual Studio will open by using an external program. By using specific extensions, such as .hta, .chm or .py, the attacker can write arbitrary code that will be executed once the file is opened.
- The vulnerability is flagged as CVE-2024-30052 and has been fixed on June 11th, 2024 in Visual Studio 2022 17.8.11.
1.0 embedded PDBs, embedded sources
A few years ago, Microsoft introduced the Portable PDB format. The format was meant as a replacement for the classic MSF format for managed modules, mainly for cross-platform support and optimizations over the standard format. At the same time, they also added the possibility of embedding Portable PDB files into the executable during compilation by using the -debug:embedded command line switch. The procedure is not really documented anywhere, at least to my knowledge, but it’s not difficult to find out how this is accomplished by e.g. reversing some C# runtime libraries and following the hints provided by public MS documentation.
- A normal portable PDB file is first produced, then compressed by using the Deflate stream.
- A data “blob” is created, containing two 32-bit values (a magic number (“MPDB”) + uncompressed size of the PDB), followed by the compressed PDB data.
- The blob is then inserted into the executable file under a special section, and referenced via a Debug Directory Entry from the PE debug directory, with:
DataPointerpointing towards the blob.DataSizebeing equal to the size of the blob.IsPortableCodeViewset to true.Typeset to 17 (aka Embedded Portable PDB)
We can see this in action by using e.g. PETools to view a .NET core DLL compiled with an embedded PDB:
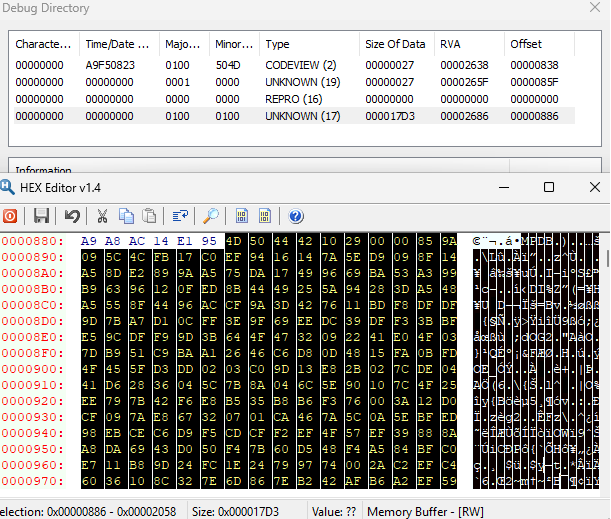
The debug directory entry at the very bottom has type 17 and we can see that the data it points towards is formatted as “MPDB”, followed by a 0x2910 (uncompressed pdb length) and then the compressed PDB data.
Folks also requested for source files to be embeddable into PDBs. This can now be accomplished in a few different ways, e.g. setting EmbedAllSources to true in the vcxproj file, or specifying -embed in compiler’s command line. The source files are embedded under the Embedded Sources Stream in the portable PDB file and can be easily extracted by the debugger when required.
The two features above are very useful when iterating on a managed project and debugging an outdated version at the same time. While this doesn’t happen often, it is usually quite frustrating (and often impossible) to debug an older dump file or an older version of the executable without having backed up the PDB or the source file associated with them. With embedded PDBs and embedded sources, the information is stored directly in the executable (and thus the dump file, if captured with full memory) and allows for the full debugging experience.
2.0 non-printable files
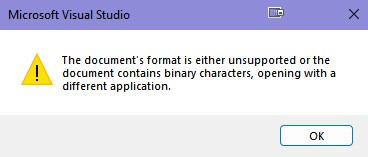
While debugging dump files, the data contained in them is fully trusted by VS. This means that embedded PDBs and sources within those PDBs will be happily accepted by Visual Studio. Even though on-disk data is preferred, if one isn’t found, the data located in the dump file will be used. While brainstorming on possible ways to abuse the trust that VS shows towards embedded source files, I remembered some odd behaviour I stumbled upon in the past. It’s somewhat well known that VS supports opening image files, but only certain formats such as JPG or PNG. Some time in the past I tried to open up a webp file and was met with the following message:
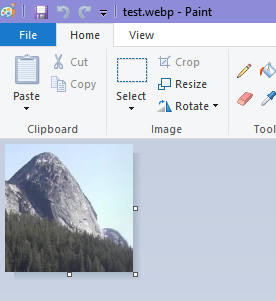
Pressing OK or X lead to the webp file being opened in Paint:
This suggested that VS can invoke external programs when it doesn’t know how to deal with a specific file type. I fired up a debugger to track down the code implementing this behaviour, and ended up with the following callstack:
... SHELL32 methods ...
shell32.dll!ShellExecuteW
msenv.dll!CExternalEditorFactory::CreateEditorInstance
msenv.dll!CVsUIShellOpenDocument::LoadCreateEditorInstance
msenv.dll!CVsUIShellOpenDocument::CreateInitEditorInstance
msenv.dll!CVsUIShellOpenDocument::OpenStandardEditor
msenv.dll!CVsUIShellOpenDocument::OpenStandardEditorAsync
... CLR methods...
msenv.dll!CVsUIShellOpenDocument::OpenDocumentViaProject2
msenv.dll!CVsUIShellOpenDocument::OpenDocumentViaProject
After a brief investigation, I found out that:
- When opening a file, VS will attempt to find an internal editor/viewer associated with the file extension.
- If there’s no associated editor, it will attempt to open the file in its default (text) editor.
- If the file contains any non-printable characters, the execution will take the code path shown above.
The most interesting entry in the call stack is CExternalEditorFactory::CreateEditorInstance. Here is it’s decompiled implementation:
HRESULT CExternalEditorFactory::CreateEditorInstance(..., const wchar_t* filePath, ...)
{
  const wchar_t* extensionPtr = wcsrchr(filePath, L'\\');
  if (extensionPtr && (CompareFilenames(extensionPtr, L".exe") == 0 || CompareFilenames(extensionPtr, L".com") == 0))
    return 0x80041FEB;

  bool useOpenAssoc = false;
  wchar_t assocProgramPath[MAX_PATH + 4];
  uint32_t assocProgramPathLen = MAX_PATH;
  HRESULT assocRes = AssocQueryStringW(ASSOCF_NOTRUNCATE | ASSOCF_VERIFY, ASSOCSTR_EXECUTABLE, extensionPtr, L"edit", assocProgramPath, &assocProgramPathLen);
  if (FAILED(assocRes))
  {
    useOpenAssoc = true;
    assocProgramPathLen = MAX_PATH;
    assocRes = AssocQueryStringW(ASSOCF_NOTRUNCATE | ASSOCF_VERIFY, ASSOCSTR_EXECUTABLE, extensionPtr, L"open", assocProgramPath, &assocProgramPathLen);
  }
  if (FAILED(assocRes))
    return 0x80041FEB;

  ...
  // checking if the name of the program is equal to devenv.exe or any of special names:
  // VBExpress, VCSExpress, VJSExpress, VCExpress, VWDExpress, VPDExpress, VSWinExpress, WDExpress, VSLauncher, vsgd, vsga
  // if so, abort
  ...

  if (CompareFilenames(filePath, assocProgramPath) != 0)
  {
    wchar_t assocProgramShortPath[MAX_PATH+1];
    GetShortPathNameW(a3, assocProgramShortPath, MAX_PATH);
    if (CompareFilenames(assocProgramPath, assocProgramShortPath) != 0)
    {
      SHELLEXECUTEINFOW execInfo = {};
      ... // set some execInfo members
      execInfo.lpVerb = useOpenAssoc ? "open" : "edit";
      execInfo.lpFile = filePath;
      execInfo.nShow = 1;
      ShellExecuteW(&execInfo);
      ...
    }
  }
  ...
}
The function above receives a bunch of parameters, amongst which is a full path of the file that needs to be opened. The calls to AssocQueryStringW are meant to fetch the default program that interacts with the extension of the filename. VS first queries the program associated with the “edit” action and if one doesn’t exist, the program associated with the “open” action. If it finds either of these, it will do a few sanity checks and if everything goes well, invoke ShellExecuteW to open up the file in its associated program.
The behaviour above suggests an outline of a possible attack by using embedded source files:
- if we can get VS to open an arbitrary embedded source file when debugging a dump file
- if we can get that source file to have an arbitrary extension
- if we can find an extension that would be associated with a program that would execute arbitrary code based on the data provided in the file it’s being opened on
then there’d be arbitrary code execution resulting from simply debugging a dump file.
3.0 crafting a poc
To test the feasibility of the attack, I tried to craft a simple poc in which I’d replace a legitimate source file in an embedded PDB with a sample PDF file, in hopes that VS would:
- treat it as a legitimate embedded source file.
- open it up through an external editor during a debug session, including dump-debugging sessions.
I chose PDF as I knew that it would certainly contain non-printable characters, and that there was definitely an associated program on the system (Firefox in this case). Crafting the poc took a few steps:
- Create a simple .NET project and rename the main file from Program.cs to Program.pdf.
- Compile the project with
-debug:portable. This produces an exe file and a dll file having on-disk portable PDBs. The source file is embedded in the PDB file corresponding to the DLL. - Modify the portable PDB file so that we replace the data of the original source file with the data of the PDF file that we wish to plant.
- I used this example to find out where in the file the embedded source is serialized. Its format is described in the format specification.
- I then replaced the data with the data of the planted PDF file. The actual file data here is compressed by using deflate. To make things easier for myself, I went back and modified the original source file to be quite large, so that there’d be enough space for the new data without having to relocate stuff and risk breaking the format.
- I also updated the hash of the source file in the document table so that Visual Studio wouldn’t reject it as invalid.
- Embed the newly produced portable PDB into the executable. I used a custom program for this, as I wasn’t aware of any tools that would do such a thing. The program would simply extend the debug directory of the executable and insert a new section containing PDB data that the new entry would link to.
- Run the executable, let it crash and create a full-memory dump. To automatically capture dumps, I followed this guide, setting
DumpTypeto 2, aka a dump with full memory captured. - Delete/rename the exe, dll, pdb and source files from the disk. This would make VS fall back to the embedded information in the dump rather than using available on-disk information.
- Open the dump file in VS. Click “Debug With Managed”.
At that point, I was faced with the same message box shown above, and pressing OK or X lead to the sample PDF file being opened in Firefox. This confirmed that the problematic code path could be reached while debugging dump files and opening embedded sources.
4.0 hunting an ace
With the hypothesis confirmed, what’s left was to find some extensions that could be used to achieve ACE. VS is filtering out some extensions, such as .exe and .com, but I was convinced that there would be others that can slip through. I ended up writing a program that iterates over all possible 2-letter, 3-letter and 4-letter extensions and prints the programs associated with them by using AssocQueryStringW.
This took only about 20 minutes in total, and I soon had a full list of associations on the PC. Even though many files could be used to execute arbitrary code when opened via their default program, most of them had an “edit” association with a text editor, which doesn’t work in our favour. After a thorough look, I identified three extensions that looked particularly adequate:
- CHM, aka Microsoft Compiled HTML. The default program used to open these files is hh.exe. This format is most commonly used for help files on Windows and will randomly pop up if you happen to mistakenly press F1 in some programs. CHM files can contain arbitrary VB code that will be run once they’re opened.
- HTA, aka HTML Application, with the associated program being mshta.exe. These are also extended html files that can contain VB code that runs when the file is opened.
- PY, aka python scripts. On a clean Windows installation this association doesn’t exist, but it’s likely that a developer will have python installed, in which case the extension will be associated with python. Of course, opening a python script can lead to arbitrary code being executed.
By default, CHM files are compiled and will contain non-printable characters. On the other hand, HTA and PY files are textual and require an injection of non-printable characters while still maintaining their functionality. This is not much of an obstacle:
- Adding non-printable characters after the end of the html tag in the HTA source doesn’t prevent hh.exe from executing the code specified within the tag.
- Adding a comment followed by some NUL characters in the python script doesn’t prevent the execution of the rest of the code.
5.0 the exploit
With everything in place, it was time to craft an exploit. However, instead of following the same steps that I outlined earlier, I wrote a C# program to handle everything automatically and fed it three different files (CHM/HTA/PY) to produce three different dumps. Once you start debugging either of them in VS, calc.exe spawns, demonstrating ACE.
The program that creates a dump file based on the input source file is available on github. You can find instructions for running it in the repository’s readme. Below is a demonstration of the poc, using a CHM input file that spawns calc.exe:
6.0 the fix
I was too lazy to fully reverse engineer the fix. But we can see one new change in CVsUIShellOpenDocument::OpenStandardEditor, which looks something like this:
HRESULT CVsUIShellOpenDocument::OpenStandardEditor(..., uint64_t flags, ...)
{
    // ++++++++
    if (flags & 0xF0000000)
    {
        return 0x80042010;
    }
    // ++++++++

    ...
    CVsUIShellOpenDocument::CreateInitEditorInstance(...)
}
The highest bit of the flags argument passed to the function is now set when opening embedded sources during debugging sessions, but not set if e.g. dragging a file into an idle VS. If the parameter is set, the function refuses to follow through on CreateInitEditorInstance, which would later to lead to the behaviour we’ve documented above.
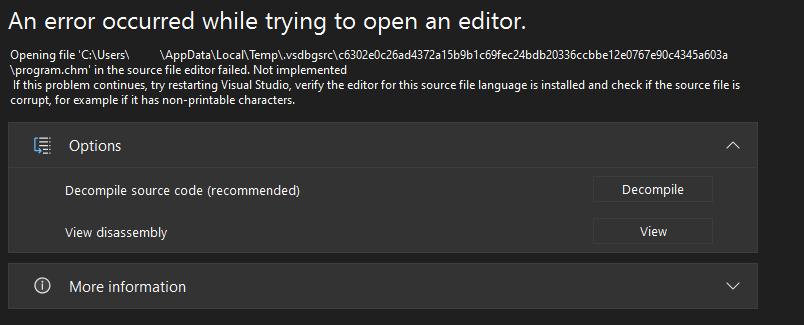
If trying to manually open the source file in VS while debugging the dump, we’re now met with the following message, meaning that VS won’t even let the user manually fall into the trap.
7.0 timeline
- August 14th, 2023 - I report the issue to Microsoft.
- September 15th, 2023 - Microsoft responds and says they consider the vulnerability as having moderate impact, i.e. “defense in depth”, and that it’s not going to be prioritized for fixing. They also say they’ve shared the details with the engineering team and that they’ll be taking the steps to keep customers protected. I disagree with the assessment but don’t push it further as I was dealing with other stuff at the time.
- January 10th, 2024 - I ask Microsoft if they plan on fixing the issue any time soon, and reiterate that it looks like a plausible attack vector.
- January 16th, 2024 - Microsoft responds and confirms there’s a plan to resolve the issue.
- May 2nd, 2024 - I reach out to Microsoft once again and ask for updates, seeing as the problem hasn’t been resolved.
- May 13th, 2024 - Microsoft responds and says that they re-opened the case and have assessed the vulnerability to be important, meaning they’ll publish an advisory with an acknowledgment. They tell me that the fix is planned for July.
- June 11th, 2024 - Visual Studio 17.8.11 is released with a fix.